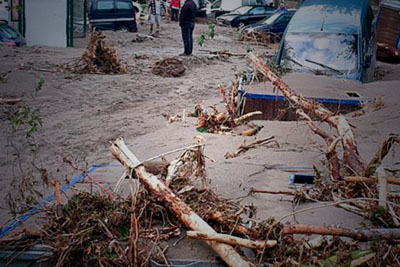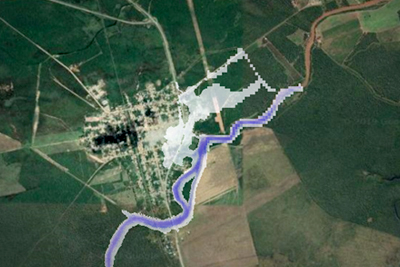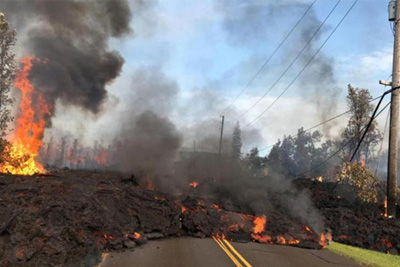
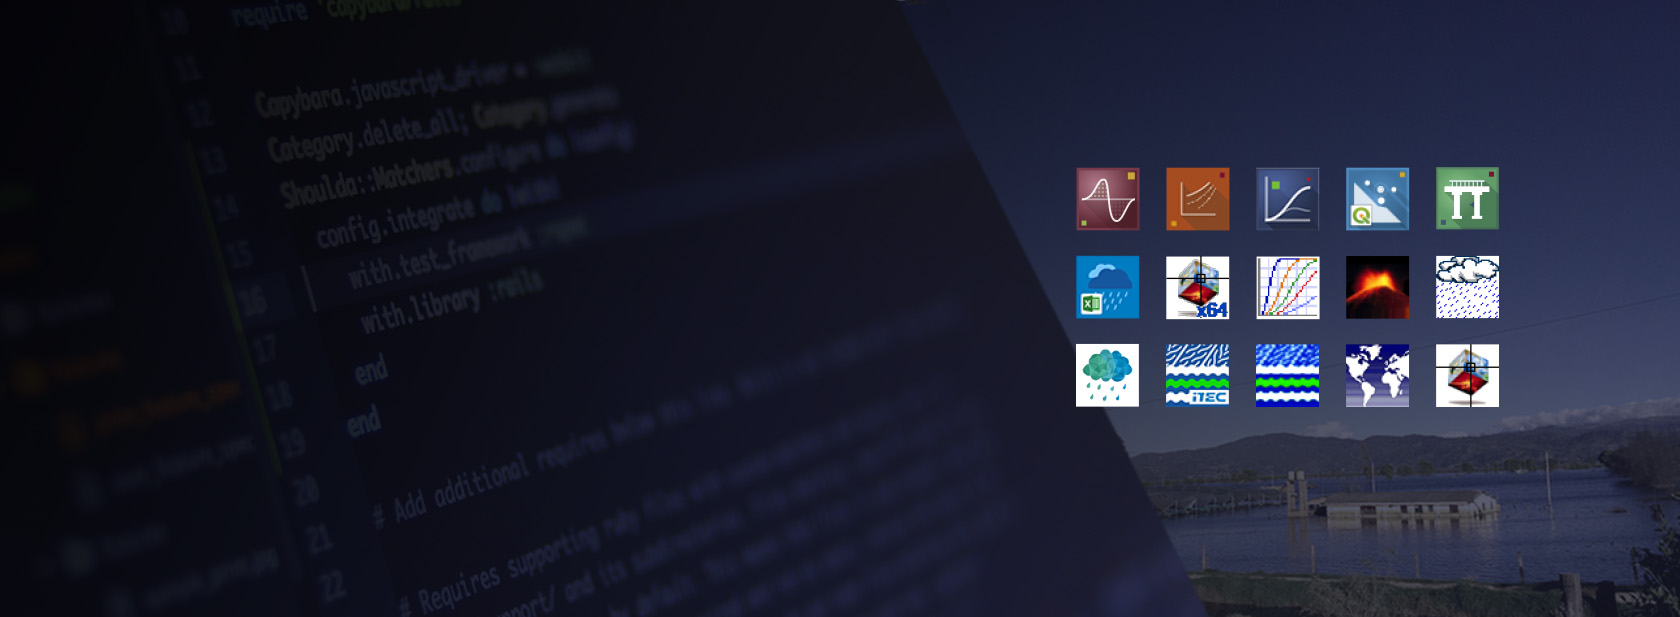

Los módulos de amenaza incluyen un conjunto de aplicaciones de software para determinar los riesgos geológicos e hidrogeológicos, y un...
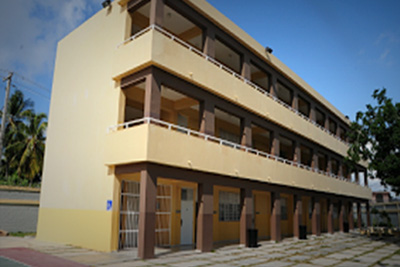
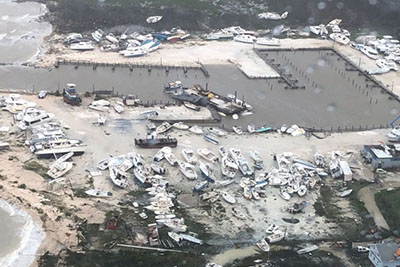
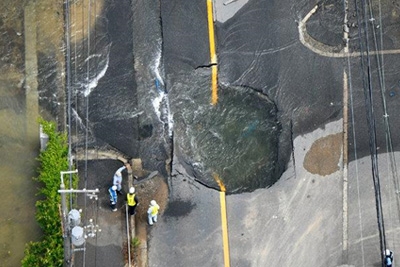
The exposure module includes tools for localization, classification and evaluation of infrastructure potentially exposed to hazards....
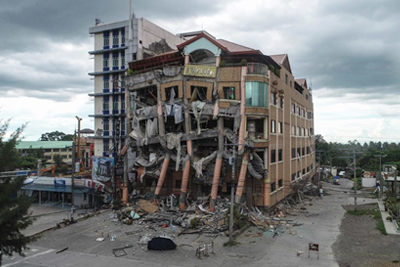
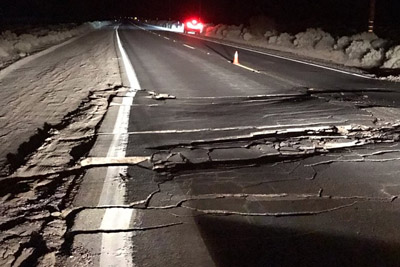
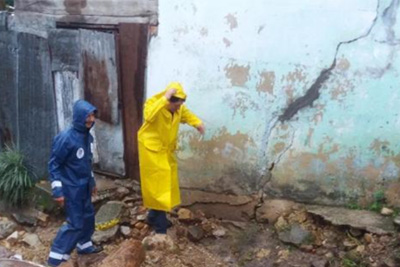
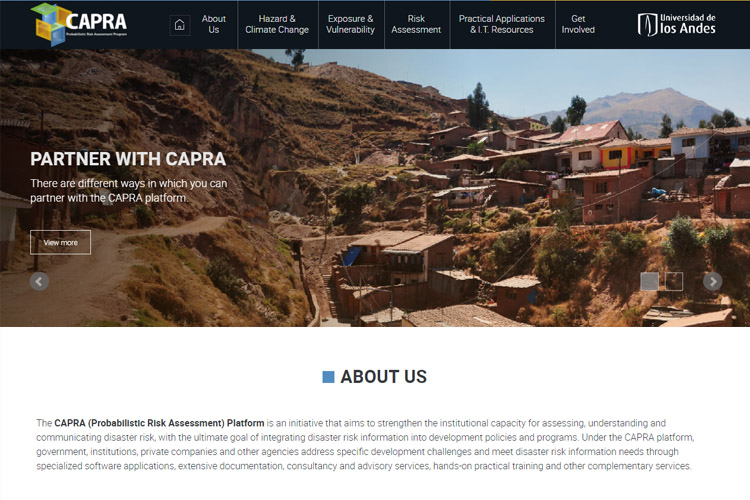
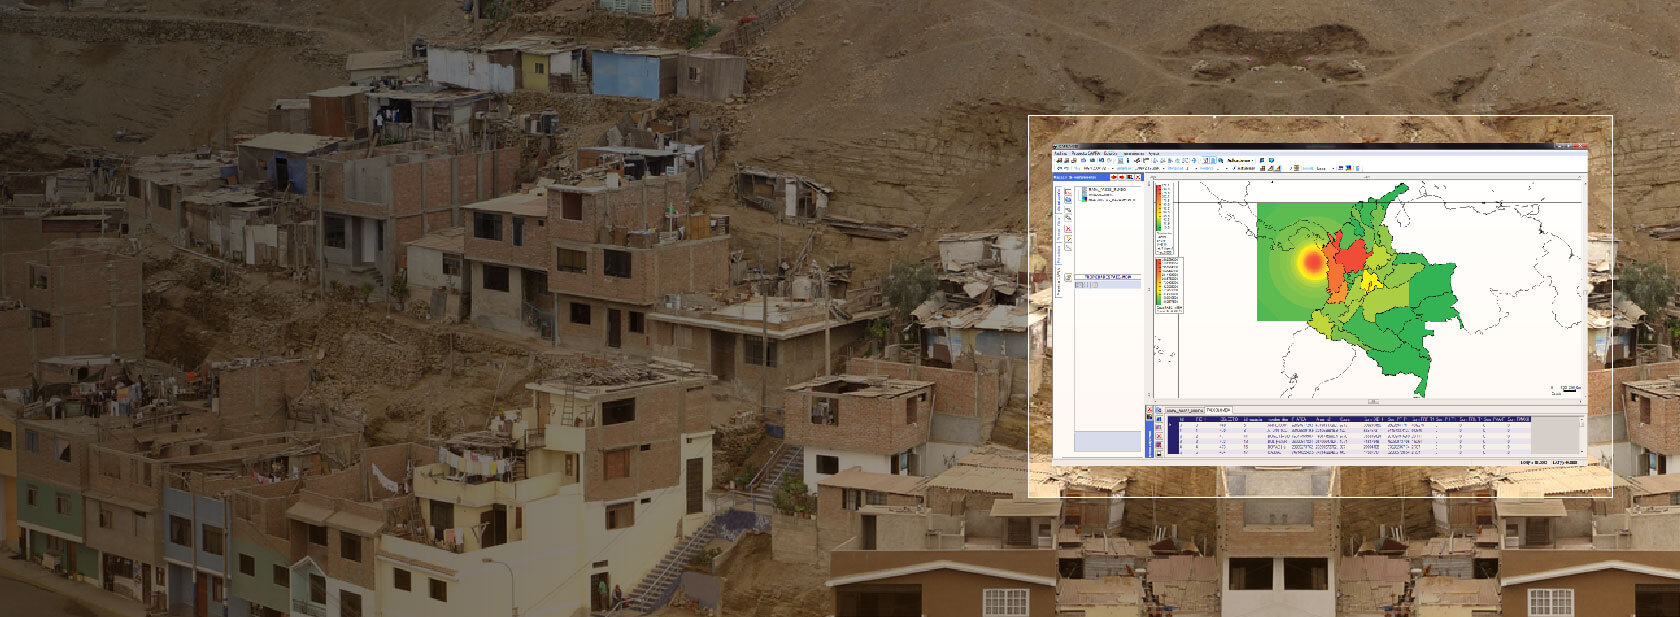
Risk assessment module includes CAPRA-GIS and software applications to determine probabilistic risk calculations based on hazard,...
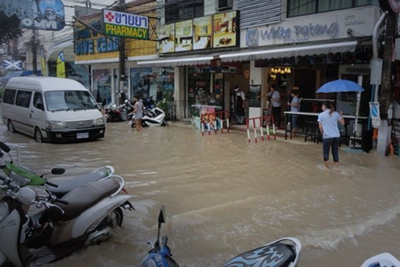
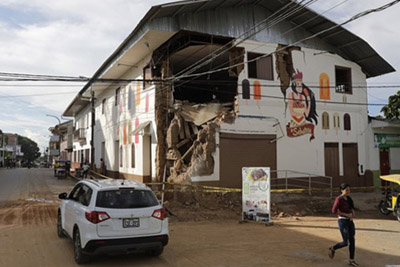
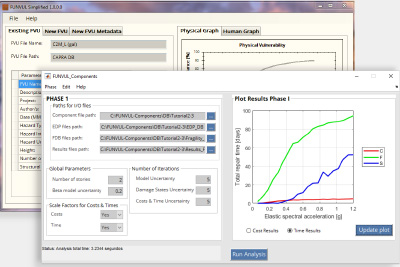
Includes additional software and tools for solutions in hazard, risk-financing strategies and risk management, also includes related...